Challenge
How closely should a land survey sample the wavefield to resolve target reflectors, and where would the planned geometry illuminate them?
VerityGeo’s work
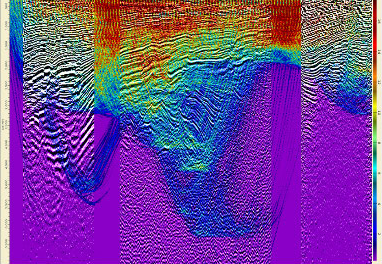
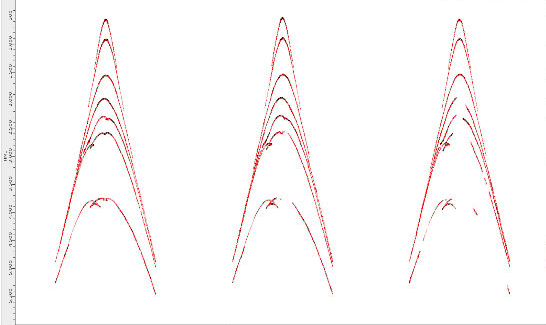
Tied synthetic seismograms from well logs to legacy seismic, built a layered velocity model and compared two layouts on six profiles along strike and dip. A separate 3D ray-tracing study mapped coverage at depth.
Documented outcome
The finer layout preserved more lateral detail in the synthetic images. The study recommended finer sampling and identified the cost trade-off of acquiring on a coarser grid and interpolating during processing.
Survey geometry comparison
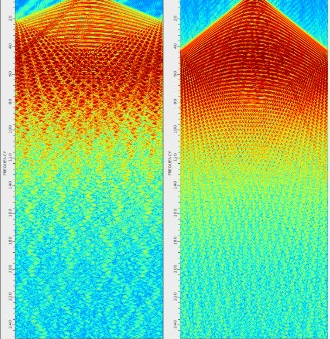
Spatial aliasing appears when station spacing is too coarse to sample a seismic event accurately. In these synthetic shot gathers, the finer layout sampled higher frequencies before aliasing appeared.
| Parameter | Coarser layout | Finer layout |
|---|---|---|
| Source and receiver station interval | 50 m | 25 m |
| Common midpoint (CMP) bin spacing | 25 m | 12.5 m |
| Approximate onset of spatial aliasing | 23 Hz | 44 Hz |
3D target illumination
Using the survey geometry and surface topography, the team traced travel-time rays through a smoothed interval-velocity model. More rays reached the central target area. Sparse well control limited how closely the team could check the velocity model there.